Portfolio > GeoPlasma-CE
From 2017 until 2019 I was mainly working for the GeoPlasma-CE project at GiGa infosystems in Freiberg.
My work for the GeoPlasma-CE project
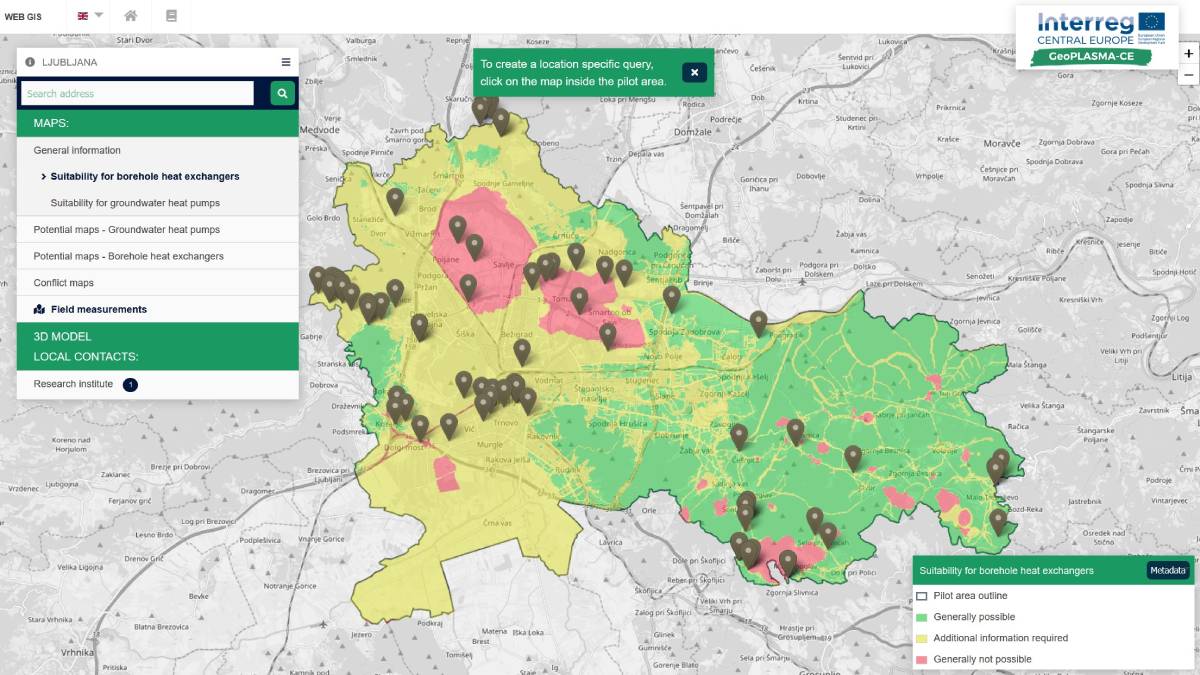
The Geoplasma-CE project was a project that was funded by Interreg-CE, an organisation of the European Union. One of the goals of the project was to develop a web based information system for geothermal energy, including a simple web GIS.
The goal of the portal was that the users can simply see if a geothermal installation is possible at their location. Location based queries, which generated a detailed report with potential conflicts and geological data could be created from the map.
During my time at GiGa infosystems, I was the main developer of the web portal. Besides the actual technical implementation of the web portal, I was also strongly involved in the conceptual planning of the system, including some user research, and the coordination between the different, international, project partners concerning the data delivery and feature requests or ideas.
This was the first time that I was involved in a project of this scale from the planning phase up until the final implementation. As there were some challenges that came up during the proccess, it was a great learning experience for me which also delivered a good final result.
While the communication between the different stakeholders and project partners in general worked well, one big challenge was getting the delivery of the geodata from the project partners to the web portal running. The requirements for this proccess changed regulary, as new ideas for features, which required additional or different kind of data, came up during the implementation. Another problem was that different project partners used different tools for preparing the actual data, which required some kind of validation proccess for the sent data.
In the end, I tried to integrate tools in the proccess that were already known and used by the project partners to make it as easy as possible for them to send the data. This meant that e.g. the metadata for the geodata was uploaded via Excel sheets and parsed on the server. In retrospect, this is something that I would have done different with the knowledge and experiences that were gained during the implementation. Excel sheets can quickly become messy and in the end there were like >30 columns and >5 different sheets that had to be parsed and brought together. It would have been better to have everything in a web form, which would have been convenient as there was already an "admin area" on the web portal where only our project partners had access to. But, in the end it also worked with all the Excel sheets and all datasets could be delivered to the web portal.
As for the tech stack, I went with PHP (Laravel) on the backend and React JS on the frontend. For saving the geodata and delivering the raster and vector tiles to the frontend, Geoserver was used. Displaying the geodata and all map related stuff in the frontend was done withe Leaflet JS. All parts of the system were connected via APIs, so that e.g. the frontend would request the metadata and geodata from the Geoserver via API.
Overall, Geoplasma-CE was a really fun project with great partners and a lot of freedom of choice. The final result got really good feedback from the project partners and external stakeholders and I'm also really happy about the final result.